
Monitoring Dashboard
The dashboard shows the results of the latest monitoring run. The layout and information depth depends on the domain and its “default” content, the selected plan and packages, the number of locations and finally the number of resource records that is monitored.
Domain overview
The default domain overview contains a result summary of the domains you monitor.
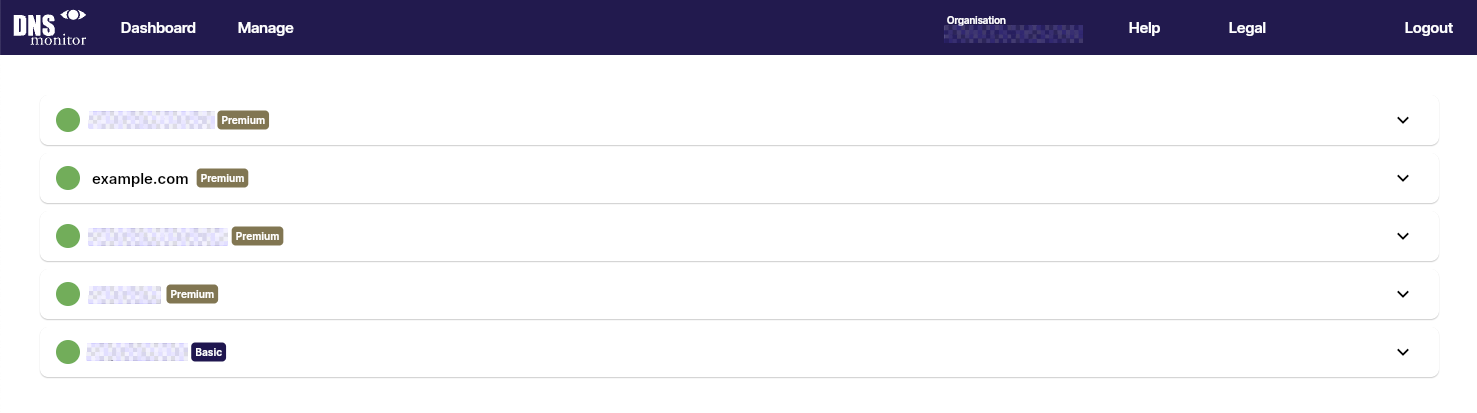
The default view contains a result summary of the domains you monitor.
The severity indicator to the left in the domain bar is the aggregated result from the Availability and Integrity checks from all underlying monitoring locations. This way you can easily identify domains with problems that need a closer look.
Next to the severity indicator is the domain name.
The icons to the right of the domain name display which plan and, in case of a basic plan, which packages are part of the monitoring plan for the domain.
Locations view

One click on the domain bar opens the location view. The location view contains one bar for each configured monitoring location with individual severity indicators for Integrity and Availability.
To the right in each location bar a timestamp, adjusted to your browsers time zone, of the last check run.
Detailed view

The detailed view shows all detailed data from each of the checks that are run, including the aggregated Integrity and Availability indicators.
Integrity and Availability indicators

Each indicator shows a percentage between 0 and 100, where 100 is the maximum result that can be achieved after each check run is completed and the relevant results for each category is calculated. You can read about which checks are included in the calculations for the Integrity result here and the Availability result here. You will also find out at which percentage and other reasons the indicators will shift between severities.
DNS matrix
The following sections are unavailable for the Basic plan without packages and when the organisation is in free mode.
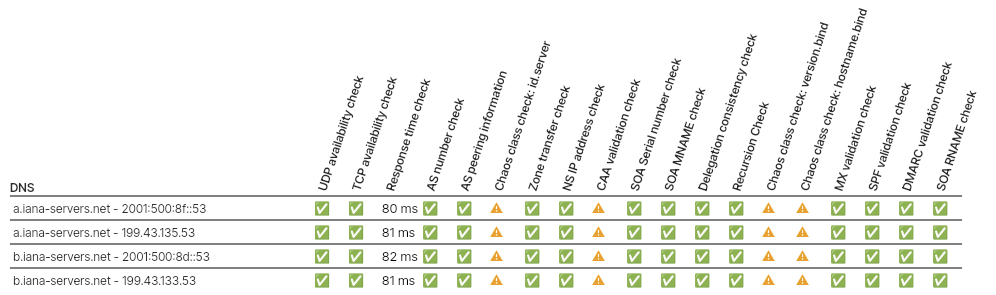
As described in the DNS check Knowledge Base many of our checks is directed to all public DNS servers for the domain. The results from each check is reported in an easy to understand matrix where each line represent one DNS server and the columns represents each check result. Where possible, to minimise the footprint, each check result is represented by an icon of different shape and color (result severity) with a few exceptions, like response time and SOA serial number errors.
Hover information fields
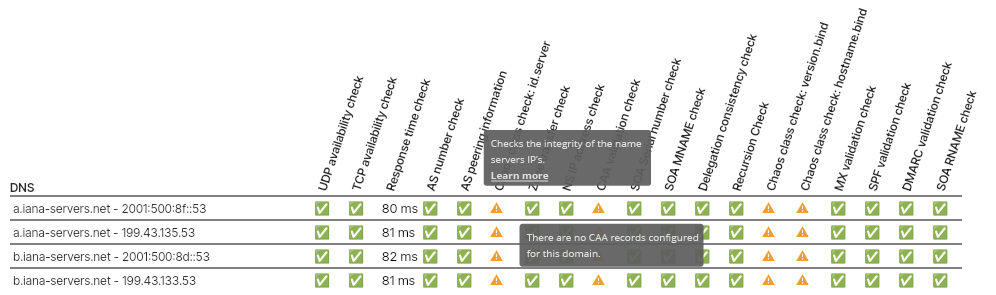
When the mouse pointer is placed over a result icon an information box will appear providing a brief description of the check result.
When the mouse pointer is placed over the check name a brief description of the check is displayed with a link to the corresponding knowledge base page.
The hover effect is similar throughout the monitoring dashboard.
Domain section
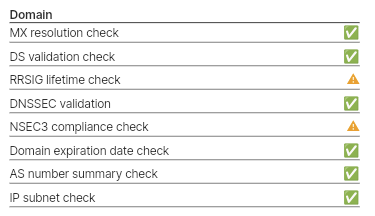
The domain section contains check results from checks that for one reason or the other isn’t executed on each individual name server. A few of these check results are a compilation of result data from DNS checks.
With the hover function described above you can access the result messages and knowledge base articles for each of the checks.
Resource records section

The resource records section shows the results of the recource record checks.